Quad-Doughnut Chart: A Fresh Take on Data Visualization
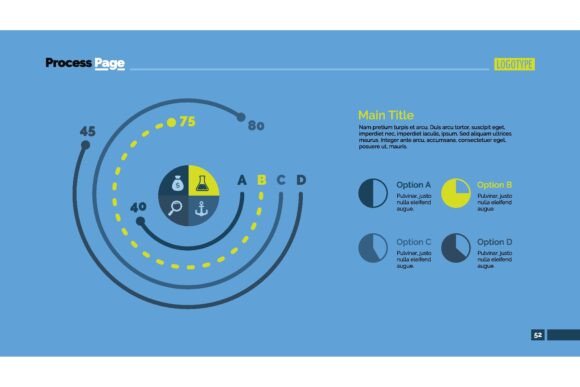
Data doesn’t have to be dry. When you’re building a presentation, writing a report, or preparing a pitch, the way you display information can make the difference between a room that tunes out and a room that leans in. The Four Options Doughnut Chart Slide Template—often called the Quad-Doughnut Chart Slide Template—offers a clean, visual way to present four distinct data points or progress metrics at once. Instead of a single pie chart or a dense table, you get four self-contained rings that each tell their own story.
This approach is especially useful when you want to compare progress across multiple categories without overwhelming your audience. Each ring acts as a miniature dashboard, showing completion rates, survey responses, budget splits, or any other percentage-based metric. The circular format feels natural and intuitive, and because the rings are separate, viewers can quickly scan each one without confusion.
What Makes the Quad-Doughnut Chart Interesting
The strength of this template lies in its structure. You have four distinct segments, each designed to show a part-to-whole relationship. But unlike a traditional doughnut chart, the quad version lets you display four independent datasets side by side. This is ideal for situations where you need to compare progress across four quarters, four teams, four product features, or four customer segments.
The design is inherently modern and clean. The empty center of each ring provides space for labels, percentages, or short callouts, which reduces the need for a separate legend. This makes the slide self-contained and easy to grasp at a glance. For anyone who regularly presents data—whether in board meetings, classroom settings, or client reviews—this template removes friction between the numbers and the audience’s understanding.
Creative Applications for Different Users
The real value of the Quad-Doughnut Chart Slide Template is how adaptable it is across roles and industries. Here are a few ways different professionals can put it to work.
Marketers Tracking Campaign Performance
If you’re managing multiple campaigns, you can use one ring per initiative. For example, four email campaigns, each with its own open rate, click-through rate, conversion rate, and bounce rate. Or use the rings to show the percentage of budget spent across four channels: social media, search ads, content marketing, and events. The visual instantly communicates which area is ahead and which needs attention.
Educators and Trainers Monitoring Progress
Teachers, course creators, and workshop facilitators often need to show completion rates for different modules or skills. Four doughnuts can represent four learning objectives, with each ring filling as students master the material. This is particularly motivating for learners who can see their own progress at a glance. It also makes end-of-term reviews more engaging than a list of percentages.
Entrepreneurs and Small Business Owners
Running a small business means juggling multiple priorities: sales, operations, customer satisfaction, and product development. A quad-doughnut slide can serve as a quarterly health check. Assign each ring to a key area, color-code them, and update the percentages before every team meeting. It becomes a quick reference that everyone can understand, even if they aren’t data experts.
Freelancers and Creators Showcasing Portfolio Metrics
If you’re a freelancer pitching to a client, you can use the template to show your performance across four projects or four skill areas. For instance, a designer might display client satisfaction rates, project completion on time, revisions per project, and repeat engagement percentage. This visual approach feels more professional and memorable than a spreadsheet.
Adapting the Template for Different Audiences
Not every audience responds to the same level of detail. The beauty of the Quad-Doughnut Chart is that you can adjust the complexity based on who is watching.
For executive stakeholders, keep the rings simple with bold colors and high-level percentages. Avoid cluttering the center with extra text—just the number and a short label. Executives want the story fast, and the rings deliver.
For team members or collaborators, you can add more context inside or around each ring. Use the center for a short goal description, and place a footnote or legend below the slide if needed. This keeps the visual clean while still providing the detail that colleagues expect.
For external clients or public presentations, lean into the aesthetic value. Use your brand colors, consistent typography, and subtle animations if the platform supports them. The template already looks polished, so you don’t need to overdesign it. A clean version with thoughtful color choices will stand out on its own.
Practical Guidance for Keeping Results Clear
To get the most out of the Four Options Doughnut Chart Slide Template, a few practical steps will help you maintain clarity and impact.
- Limit each ring to one clear metric. Don’t try to cram multiple data points into a single ring. Each ring should represent a single percentage or progress value. This keeps interpretation immediate.
- Use consistent scaling. If one ring shows 0–100% and another shows 0–50%, the visual comparison becomes misleading. Keep the scale uniform across all four rings, or at least label them clearly.
- Choose a cohesive color palette. You don’t have to use four different colors. Sometimes a monochromatic scheme with varying shades works better, especially if you want to emphasize a single theme. For contrast, use complementary colors that don’t clash.
- Label directly rather than relying on a legend. Place the label in the center of each ring or immediately next to it. This eliminates the back-and-forth between the chart and a legend key, which slows down understanding.
- Keep the background simple. The rings are the stars of the slide. Avoid busy backgrounds, excessive shadows, or decorative elements that distract from the data.
Variations and Creative Directions
Once you feel comfortable with the basic template, consider experimenting with a few variations to keep your presentations fresh.
- Progress rings with icons. Place a small icon inside the center of each ring that represents the category. A dollar sign for budget, a person for team satisfaction, a graph for performance. This adds visual interest without adding text.
- Sequential reveal. If you’re presenting live, reveal each ring one at a time. This builds narrative tension and lets you discuss each metric before moving to the next. It works especially well for storytelling.
- Combined with a summary ring. Add a fifth, larger ring in the center that shows an average or total of the four. This creates a layered visual where the audience can see both the big picture and the individual components.
- Themed color coding. Match the ring colors to your brand or to the theme of the presentation. For a health and wellness topic, use greens and blues. For a financial report, use more neutral or corporate tones.
Why This Template Works for Real-World Needs
The Quad-Doughnut Chart Slide Template isn’t a gimmick. It solves a real problem: how to show multiple progress metrics without overwhelming your audience. In a world where attention spans are short and data is everywhere, visuals that simplify are worth their weight in design time. Whether you’re a marketer reviewing quarterly metrics, an educator tracking student progress, or a freelancer building a portfolio pitch, this template gives you a structure that is both flexible and professional.
The rings invite comparison without forcing a hierarchy. They allow the viewer to move from one metric to the next naturally. And because each ring is self-contained, you can swap out data without redesigning the entire slide. That flexibility makes it a practical tool for ongoing use, not just a one-off design.
So the next time you’re staring at a spreadsheet full of percentages, consider pulling out the quad-doughnut approach. Give your data room to breathe, and let the rings do the heavy lifting. Your audience will thank you for it.