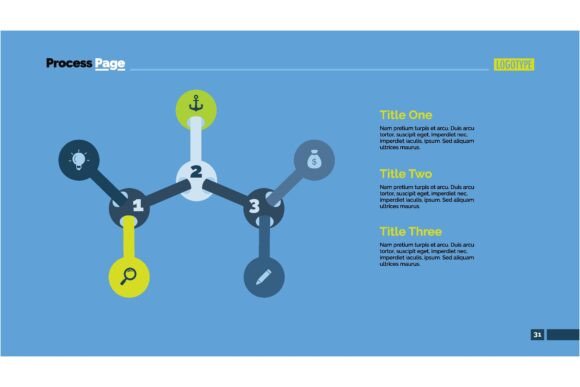
Tree Structure Diagrams: Branching Visuals for Data
Imagine a single starting point that splits into multiple paths, each branching further into finer details. That is the essence of a diagram with branches. Often called a tree diagram, tree structure, or dendrogram, this visual organizes information hierarchically from a root node outward into limbs and leaves. It mirrors how we naturally categorize ideas: broad categories at the top, specific subpoints below. Whether you see it in a family tree, a decision flowchart, or an organizational chart, the branching structure transforms complexity into clarity. For anyone who needs to communicate layered information quickly, this diagram is a silent but powerful ally.
Why a Branching Diagram Matters Across Different Fields
A tree structure does not belong to any single industry. Its logic applies wherever relationships cascade from general to specific. A marketer might use it to map a customer journey from awareness to purchase. A biologist could trace evolutionary relationships. An educator might break down a lesson into modules and submodules. The underlying appeal is the same: it reveals how pieces connect without overwhelming the viewer. Because the human brain processes hierarchical information naturally, this format reduces cognitive load. You see the whole picture and the parts simultaneously.
For a small business owner, a tree diagram might clarify employee roles or product categories. For a freelancer, it could organize service offerings or project deliverables. The versatility comes from the structure itself, not the content. That is why this visual element appears in annual reports, onboarding materials, strategy decks, and even personal planning tools.
Different Audiences, Different Priorities
Not everyone approaches a tree diagram with the same expectations. A beginner wants simplicity. An experienced data analyst cares about precision and scalability. A creator focuses on aesthetics. Understanding these differences helps you choose or design a diagram that fits your specific context.
Beginners and Hobbyists: Ease of Use Comes First
If you are new to visual communication, a branching diagram should feel intuitive, not intimidating. You likely want a template that lets you plug in text and see the structure form automatically. Many online tools offer drag-and-drop tree diagrams where you add branches by clicking a button. For a hobbyist planning a family history project, the priority is readability and quick setup. You probably do not need advanced customization. What matters is that the diagram explains your information without requiring design skills. Look for tools with built-in connectors, automatic layout adjustments, and simple export options. A mistake many beginners make is overcomplicating the design. Keep the branches clean, use one color per level, and limit the depth to three or four tiers so the viewer never feels lost.
Professionals and Business Owners: Reliability and Commercial Value
When a tree diagram appears in a client presentation or an annual report, the stakes are higher. You need reliability: the diagram must render correctly across devices, maintain alignment when edited, and look polished in print or on screen. For a business owner mapping product categories or supply chain steps, the structure must be accurate and easy to update as the business evolves. Cost also matters—enterprise tools with collaboration features often come with a subscription, while free options may limit export quality. Consider how often you will reuse the diagram. A one-time use might justify a free tool. A recurring internal process might warrant an investment in software that integrates with your existing documents. Additionally, professionals often value consistency with brand guidelines. Choose diagrams where you can adjust font styles, colors, and line thickness to match your company identity.
Creators and Educators: Flexibility and Learning Value
For a creator designing an infographic, the diagram must be visually compelling. You may want organic, hand-drawn branches or sleek geometric lines. Flexibility in shape, color, and layout becomes critical. Educators, on the other hand, prioritize learning value. A tree diagram in a classroom should show clear relationships without visual clutter. Students need to see how each branch connects to the root. If you teach decision-making, a branching flowchart helps learners trace different outcomes. The best diagrams for education use consistent spacing, logical grouping, and labels that reinforce the concept. For both creators and educators, speed matters less than clarity. Take time to align the structure with the story you want to tell. A well-made tree diagram can replace pages of text and become a reference tool students return to.
Consumers and Marketers: Presentation and Emotional Appeal
If you are a marketer presenting data to clients, the diagram’s visual appeal influences credibility. A polished, well-proportioned tree structure signals professionalism. Consumers evaluating a product or service may encounter a tree diagram in a comparison chart or a feature breakdown. For them, the diagram must be instantly understandable. Avoid dense text on branches. Use icons or short phrases instead. Marketers often prioritize speed—creating a diagram quickly for a tight deadline. In this context, templates and auto-formatting tools save hours. But do not sacrifice quality for speed. A rushed diagram with misaligned branches or inconsistent fonts undermines the message. Find a balance by using a reliable tool you already know, so setup time stays low without looking sloppy.
Key Factors to Evaluate Before Choosing a Tree Diagram
Knowing what matters to different users helps you ask the right questions. Here are the core factors to consider when deciding whether a tree structure fits your project and which approach to take.
- Ease of use: How quickly can you create the diagram? Does the tool require learning curves or offer templates? Beginners and one-time users should prioritize this.
- Flexibility: Can you customize colors, branch angles, line styles, and node shapes? Creators and educators often need this freedom more than business users.
- Presentation quality: Does the diagram look professional in high resolution and across formats? Marketers and professionals should test export quality before finalizing.
- Scalability: Can the diagram handle many branches without becoming cluttered? Data analysts and project managers need a structure that remains readable as it grows.
- Cost: Free tools may limit features or branding. Paid tools offer more but require budget justification. Hobbyists may prefer free, while businesses often accept paid for reliability.
- Long-term usefulness: Will you reuse this diagram type? If yes, invest in a tool that saves templates and allows easy updates.
Practical Examples for Different Reader Types
Seeing a tree diagram in action makes its value tangible. Here are scenarios that reflect how different readers might use the same structure for entirely different goals.
A freelancer organizing services: You offer content writing, editing, and strategy. A tree diagram can show each service as a main branch, with sub-branches listing deliverables, timelines, and pricing. When a potential client asks for clarity, you share the diagram instead of a long email. It saves time and reduces misunderstandings.
A product manager mapping features: Your software has three core modules. Each module splits into features, and each feature splits into user stories. A tree diagram helps the development team see dependencies and prioritize work. It also serves as a visual roadmap during sprint planning.
A teacher explaining a historical event: A tree structure can show causes at the top, the event itself in the middle, and consequences branching below. Students grasp causality visually. This works better than a paragraph of text because the relationships are immediately clear.
A hobbyist planning a garden: Categories like vegetables, herbs, and flowers branch into specific plants, which then branch into planting months and care tips. The diagram becomes a seasonal guide you can post on your shed wall. It is practical and personal.
Is a Tree Diagram Right for Your Project?
Before committing to a branching structure, ask yourself a few questions. Does your information naturally follow a hierarchy from broad to specific? Are the relationships parent-child, meaning each item belongs to one category above it? If yes, a tree diagram is a strong choice. If your data involves many cross-connections or non-hierarchical links, a network diagram or mind map might serve better. Also consider your audience. Will they benefit from seeing the structure at a glance? Will they need to trace paths from root to leaf? For audiences unfamiliar with the topic, a shallow tree with two or three levels works best. For expert audiences, deeper trees with more nodes can convey nuance. Finally, think about the medium. A tree diagram printed on a poster must be larger and simpler than one embedded in a digital report where users can zoom. Match the complexity to the format.
A diagram with branches is not just a decorative element. It is a functional tool that respects how the mind organizes information. Whether you are a beginner creating your first chart or a professional refining a data-heavy report, the tree structure offers a clear path from confusion to clarity. By choosing the right level of detail, the right tool, and the right visual style, you make the diagram work for you—not the other way around.