United Kingdom Map Illustration Template
Map design sits at a sweet spot where data meets storytelling. A well-made map can clarify complex regional information, anchor a brand identity, or turn a dry presentation into something genuinely engaging. The United Kingdom Map Illustration Template—and its colorful infographic counterpart—does exactly that, but with a level of polish that saves hours of manual layout work. Designed for creators who need results fast without sacrificing quality, this template offers a blend of flexibility, resolution, and file compatibility that makes it useful across a wide range of projects.
What Makes This Template Stand Out
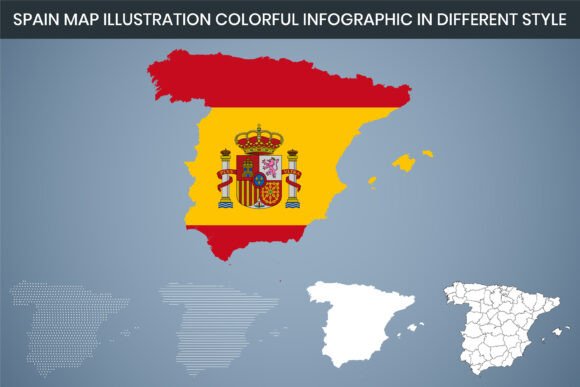
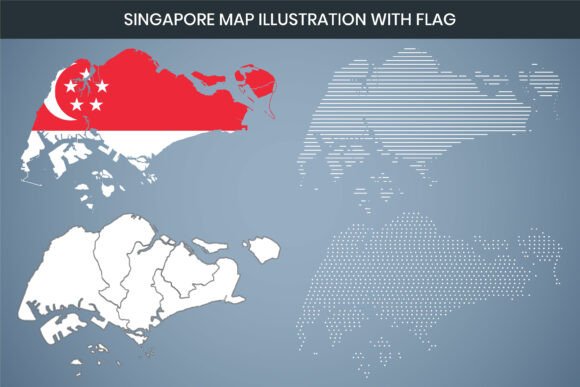
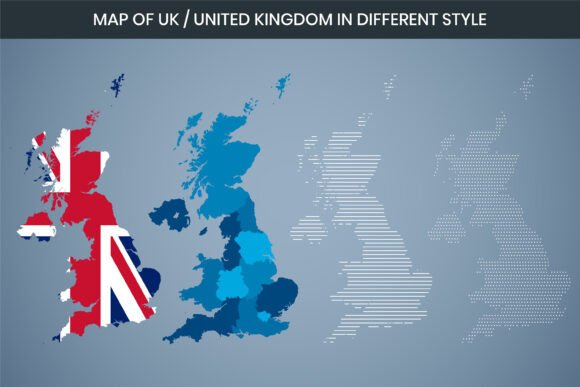
At its core, this is a vector-based map of the United Kingdom built for customization. The 300 DPI resolution ensures that whether you are producing a digital graphic for social media or a large-format printed poster, the edges stay crisp and the colors remain clean. The laser-cut design style gives the map a distinctive, modern look—think clean lines and precise borders that add a tactile, almost architectural feel to the illustration.
The RGB color mode is standard for screen-based work, but the real advantage lies in how easily you can shift the palette to match a specific brand or campaign. Because the file is fully editable in Canva and comes with AI, SVG, EPS, and DXF formats, you are never locked into one software ecosystem. Whether you work in Illustrator, Inkscape, CorelDRAW, or directly in Canva’s browser-based editor, the template adapts to your workflow rather than forcing you to adapt to it.
A Note on File Formats
Having multiple formats is not just a convenience—it expands what you can actually do with the map. The DXF format, for example, opens up possibilities for laser cutting on physical materials like wood or acrylic. The SVG and EPS files scale infinitely without losing quality, making them ideal for responsive web graphics or large banners. The AI file, meanwhile, preserves layers and editable paths, so you can tweak individual regions, adjust typography, or swap colors without redrawing anything from scratch.
Creative Applications Across Audiences
Different users will naturally approach this template with different goals. The beauty of a well-structured infographic map is that it serves both as a visual anchor and a functional data tool. Here is how various audiences can adapt it meaningfully.
Designers and Creative Professionals
If you are a graphic designer working on a tourism campaign, a travel blog brand, or a regional business directory, this template provides a ready-made base. You can overlay location markers, add custom icons for landmarks, or apply a gradient color scheme that highlights the four nations of the UK. Because the file is layered, you can isolate Scotland, Wales, Northern Ireland, and England to color each region independently, which is especially useful for audience segmentation in marketing materials.
For a travel brand, consider using a muted color palette with one accent color drawing attention to a specific region—say, Cornwall for a seaside campaign or Edinburgh for a festival promotion. The laser-cut aesthetic works well here because it gives the map a clean, contemporary feel that avoids looking like a generic clip art outline.
Marketers and Small Business Owners
Marketers often need to communicate location-based data quickly. The colorful infographic template allows you to turn raw statistics—such as regional sales figures, population densities, or store locations—into a visual story. Instead of listing numbers in a table, you can embed them directly into the map, using color intensity to show highs and lows.
For example, a small business expanding into new UK cities could use the template to create a visual roadmap of current and future locations. Use a light grey for unserved areas, a mid-blue for existing branches, and a bright orange for upcoming openings. The result is a slide or social post that communicates the growth plan in under three seconds.
Educators and Publishers
Teachers, textbook designers, and e-learning content creators need maps that are accurate but also visually engaging enough to hold a student’s attention. The editable nature of the template means you can label regions, add compass roses, or include a scale bar directly in the file. For a geography lesson, you might use the colorful infographic to show climate zones, population centers, or historical county boundaries.
The SVG format is especially useful here because it can be embedded directly into web-based learning platforms without resolution loss. And if you are producing a printed workbook, the 300 DPI output ensures that even small text and fine lines remain legible.
Hobbyists and Freelancers
If you are a hobbyist working on a personal project—like a family heritage map showing where relatives lived across the UK, or a travel scrapbook—you do not need expensive design software. The Canva compatibility makes the template accessible even if your main tool is a free Canva account. You can change colors, add text, and export in a format that works for print or social sharing without learning vector editing software.
Freelancers who take on varied projects will also appreciate the format flexibility. One week you might design a UK map for a client’s annual report (using the AI file for precision), and the next week you could cut a physical map from plywood using the DXF file. The template becomes a reusable asset rather than a one-off purchase.
Practical Recommendations for Better Results
Getting the most out of this template means thinking beyond the default design. Here are a few approaches to keep your results clear, consistent, and audience-friendly.
Keep Your Color Scheme Intentional
The colorful infographic version works well because color carries meaning. But too many colors can muddy the message. Stick to a set of three to five hues that align with your brand or topic. If the map is part of a larger presentation, pull colors from your brand palette rather than introducing new ones. For data-heavy uses, use a single color family with varying saturation—lighter shades for lower values, darker shades for higher values. This makes the map readable at a glance.
Layer Information Thoughtfully
A map template can quickly become cluttered if you try to include everything on one layer. Use the editable file structure to separate different types of information. Put the geographic outline on one layer, labels on another, data points on a third, and decorative elements on a fourth. This way, you can toggle visibility depending on the format. A social media post might only need the base map and one highlight region, while a printed brochure could include all layers.
Consider the Final Output Medium
Where the map will be seen changes how you should prepare the file. For digital use, you can rely on the RGB color mode and export as PNG or SVG. For print, you might want to convert the file to CMYK at some point, though working in RGB and then converting at the end is often fine for short-run print jobs. If you are laser cutting, the DXF file should be checked for closed paths and uniform line weights before sending to the cutter. A quick review of the vector paths in your software of choice prevents wasted material.
Adapt the Layout for Different Platforms
A map that works well on a 16:9 slide may look awkward in a square Instagram post or a vertical Pinterest graphic. Because the template is editable, you can adjust the aspect ratio without redrawing the map. Use the grouped vector objects to scale the map proportionally, then reposition elements like labels or legends to fit the new canvas. The scalable vector formats make this process smooth, as you are not losing resolution when resizing.
Beyond the Obvious: Unconventional Uses
The template is not limited to standard infographics or presentations. Consider these less common but highly effective applications:
- Interactive web maps: Export an SVG version and add CSS hover effects to highlight regions when a user rolls over them. This works well for real estate websites, travel guides, or regional directories.
- Merchandise and products: Use the laser-cut DXF file to create wooden coasters, keychains, or wall art featuring the UK outline. The clean vector paths ensure precise cuts even on intricate shapes.
- Event materials: For a conference or workshop focused on the UK market, use the colorful infographic as a registration desk poster or a slide background. The professional look sets a serious tone while keeping the design approachable.
- Social media stories: Export a transparent PNG with only the map outline and use it as a overlay on location-based stories. This adds a subtle geographic context without distracting from the main photo.
Staying Organized and Consistent
When using the same template across multiple projects, organization becomes important. Save the base file in a dedicated folder and keep a master copy that you never edit directly. Make duplicates for each project and rename them clearly—for example, “UK_Map_ClientA_SalesRegions.ai” instead of “Map_v2.ai.” This simple habit saves time when you need to revisit an old project or reuse the template for a different purpose.
Consistency also applies to the visual style. If you use the template for a series of blog posts or a multi-page report, maintain the same color palette, label font, and line thickness across all instances. Your audience will subconsciously recognize the visual language, which builds trust and makes your content feel more cohesive.
Final Thoughts on Getting Started
The United Kingdom Map Illustration Template is not just a design asset—it is a starting point. Its combination of high resolution, multiple file formats, and Canva editability means it fits into almost any creative workflow. Whether you are a designer refining a client pitch, a marketer visualizing regional data, an educator building a lesson plan, or a hobbyist experimenting with laser cutting, having a reliable, editable map saves you the tedious work of drawing borders from scratch.
Load the file into your preferred tool, experiment with the colors, add your own data points, and see how the map adapts to your specific needs. The most effective designs are rarely the ones that stay closest to the original template. They are the ones where the user understood the tools at their disposal and pushed them in a direction that served their audience. This template gives you the flexibility to do exactly that.